


-
-
Monday-Friday 8-6 CST1-800-276-6508

The following article and data charts will give you more than 50 years of data on either the average or median priced home in the United States versus silver and gold bullion values.
We begin with four regional median sales price charts from the Federal Reserve’s website (FRED Economic Data). The median house price is the exact middle home price amongst all the homes sold annually per region (e.g. half the homes sold for less, half sold for more).
The following charts illustrate median home prices in US dollars starting before silver was taken out US circulating coins in 1963 all the way up to 2016.
 This chart starts in 1963 at $16,800 ending in 2016 at $278,800 USD per median house sale.
 This chart starts in 1963 at $18,000 ending in 2016 at $360,400 USD per median house sale.
 This chart starts in 1963 at $17,500 ending in 2016 at $291,000 USD per median house sale.
 This chart starts in 1963 at $20,400 and ends in 2016 at $434,450 USD per median house sale.
Of course when buying real estate, location is a very important factor in determining value.
For example the average home in a large urban center like west Los Angeles will of course cost more than one in a rural southern town in northern Mississippi for instance.
Now that we have some regional price nuance established, the following is the overall annual median sales price for all homes sold in the United States going back to when 90% silver coins circulated as money up until the end of 2016.
 This chart starts in 1963 at $17,800 and ends in 2016 at $308,500 USD per median house sale.
A very simple calculation we can perform (at the moment of writing this article) is dividing the median sales price of a home in the USA by its 1963 price in silver and gold versus its 2016 silver or gold price.
It cost 71,200 silver 90% quarters or 178,000 silver 90% dimes to buy a median price home at the start of 1963. That equates to 12,816 oz of silver per median priced home.
In the beginning quarter of 2016, a median priced home in the USA cost $312,800 USD while silver averaged about $15.21 oz. That means a median priced home in the USA cost about 20,565 oz of silver. Thus over the measured 53 year time span median priced homes had gained 60.4% in value versus silver.
In 1963 the gold price was $35.25 oz hence the median price home in the USA cost about 505 oz of gold bullion. In the first quarter of 2016 the gold price averaged about $1,201.40 oz thus it cost about 260 oz of gold bullion to buy a median price home in the USA at the time. Over this measured 53 year time span median priced homes had lost 48% in value versus gold.
Why did gold perform so much better versus median prices US housing in comparison to gold?

In 1963, the gold silver ratio was 27.37 while for much of 2016, the gold silver ratio hovered just over 70 ounces of silver to buy 1 oz of gold.
In other words, silver was much more valuable in terms of housing and gold back in 1963 as compared to 2016. Perhaps this is one reason why so many bullion buyers today choose to purchase silver bullion over gold believing it to be the more undervalued precious metal.
Courtesy of Nick Laird’s GoldChartsRus.com, in the following chart we can see the average US house price versus gold over the last 52 years. Note that the following chart measures the average and not the median sales price per home (thus the house price is skewed slightly higher).
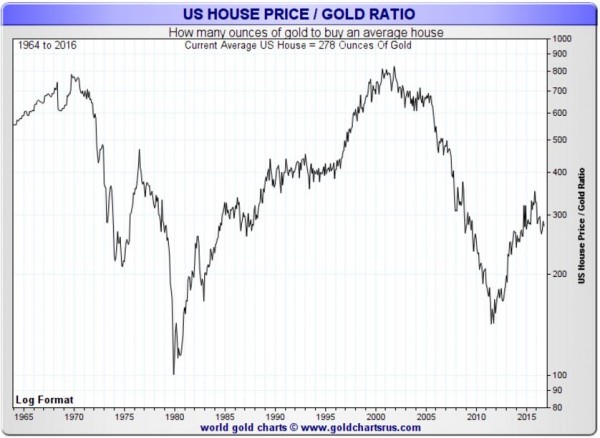
Looking at the chart we see two distinct timeframes when US housing peaked in value versus gold (just before Nixon’s closing of the gold window in 1971 and around the peak of dot com equity bubble in 2001).
From the two peaks of average housing prices versus gold of 800 oz we see two separate dramatic drops which followed. In 1974 just over 200 oz of gold could afford an average US house, followed by a temporary recovery back up just shy of 500 oz in 1976. The fall in average US house prices from 1976 to gold’s bull market peak in January 1980 touched about 100 oz of gold per average US house price. Within a ten year timeframe gold had increased in value by 700% versus average US house prices.
Perhaps thus far in the 21st Century, we are again witnessing a similar phenomenon of gold strengthening versus housing possibly stretched out over more than double the time frame than the past western-world only gold bull market of the 1970s. The chart suggests that a revisit to 100 oz of gold versus the average US house price is possible in the future. A bit more on why shortly.
For now let’s turn our attention to silver vs average US house prices.
Courtesy of Nick Laird’s GoldChartsRus.com, in the following chart we can see the average US house price versus silver over the last 52 years. Note that the following chart measures the average and not the median sales price per home (thus the house price is skewed slightly higher).

Looking at the chart we see two distinct timeframes when US housing peaked in value versus silver (once just before Nixon’s closing of the gold window in 1971 and just after the peak of the dot com equity moving into the start of the US housing bubble in 2003).
By the end of 1971 average US house prices had peaked against silver for the next 15 years at just over 20,000 oz of silver per average house. By 2003, the average US house price peaked at an all time high of over 50,000 oz of silver per home. Within the following eight years to follow, silver had increased in value by close to 900% versus average US house prices. Since silver spot prices came close to $50 oz in 2011, we have seen a recovery in average US house prices (especially versus silver). Is this simply a longterm dead cat bounce we are witnessing in silver versus average home prices in the 21st Century?
Will we again witness a day when 2,000 oz of silver can buy the average priced US home?
As the USA’s largest generation (baby boomers) moves into retirement at a clip of about 10,000 per day and more than half of the millennial generation currently living paycheck to paycheck (many suffering under the burden of record sized college loans unpaid), the question of who will buy the currently unowned and soon to be sold inventory of US houses remains.
By studying and understanding the USA’s median and average price home data to silver and gold values, you can garner a better idea of when housing may be expensive or cheap in terms of bullion ounces (i.e. cheap perhaps at the peak of the last bullion bull market in 1980 versus overpriced during the early 2000s US housing bubble).
Subscribe to the JM Bullion newsletter to receive timely market updates and information on product sales and giveaways.
MAJOR PAYMENT METHODS ACCEPTED


© Copyright 2024 JM Bullion. All Rights Reserved.
