


Free Silver Price Widget For Your Website
This feature is only supported in the desktop browsers. Please visit this page in your desktop browser to retrieve the widget.
Share live silver prices with your website followers or on your blog, using our free silver price widget. To get started, please select one of the size dimensions from the drop-down menu below, and copy the code from the Widget Code text box and paste it into the desired position in your page. If you have any trouble, please contact us at support@jmbullion.com.
Widget Preview
Widget Code
Silver Prices in New Zealand Dollars
Silver is sought after and traded all over the world. Due to its long history as a reliable store of wealth and value, silver changes hands in markets all over the world. Although silver is often quoted in U.S. Dollars, the white metal can be quoted, bought and sold using any currency. Regardless of the currency that silver may be quoted in, prices are typically listed by the ounce, gram and kilo.
The New Zealand Dollar is the official currency of not only New Zealand, but also the Cook Islands, Niue, Tokelau, the Ross Dependency and the Pitcairn Islands. The New Zealand Dollar is a favorite among currency traders, and is often referred to as the “kiwi” for the indigenous bird.
The New Zealand Dollar was introduced in 1967, and consists of five coins and five banknotes. Like many other currencies, each New Zealand Dollar may be subdivided into 100 smaller units of currency or cents.
Silver Pricing in New Zealand Dollars
The global silver market is very large and is in a constant state of flux. Regardless of what currency silver may be quoted or traded in, its price can be impacted by numerous economic and geopolitical factors. Some of the major potential influences on the price of silver include:
- Interest rates
- Currency markets
- Inflation
- Investment demand
- Industrial demand
- Geopolitics
- Investor sentiment
Unlike its counterpart gold, the silver market may potentially benefit from not only investment demand but also industrial demand. Silver is currently used in a wide assortment of industrial arenas, and more applications for the white metal are likely to be discovered. Some of the current uses for silver in industry include use in solar energy panels, electronics, nuclear power, disinfectants and chemical production.
The New Zealand Mint
The New Zealand Mint is the only precious metals mint located in the country. This mint has been in business for over 40 years, and is highly respected among the global bullion community for its quality and designs. It was also one of the first mints in the world to adopt the .9999 purity standard for gold coins.
The New Zealand mint also provides trading services as well as secure storage options. The mint’s main headquarters are located in Auckland, New Zealand.
The mint produces numerous gold and silver bullion and collectable coins. The mint produces coin collections celebrating such things as the movie “Star Wars,” Disney Classics, Creatures of Greek Mythology and more.
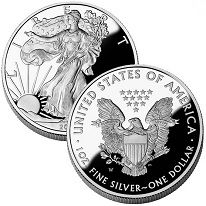
The 2016 1 Ounce New Zealand Monkey Silver Coin is a fine example of the quality and craftsmanship the mint is known for.
This particular silver bullion coin contains one troy ounce of .999 percent fine silver. Like many other popular coin series, these coins celebrate the Chinese Lunar Calendar. All coins of this series feature the same obverse design: The right profile portrait of Her Majesty Queen Elizabeth II.
The coin’s reverse features the latest image from the lunar series from the mint. This particular series features the monkey, as well as the phrase: “2016 Year of the Monkey.”
The New Zealand Economy
The New Zealand economy is one of the most globalized in the world and it relies heavily on international trade. The nation has a diverse market economy, with its service sector accounting for a significant portion of GDP. Some of New Zealand’s top exports include milk, butter, rough wood, and sheep and goat meat. Due to their close proximity and the Closer Economic Relations free trade agreement between New Zealand and Australia, the New Zealand economy may be closely aligned with the Australian economy.
New Zealand has abundant resources of iron ore, limestone, coal, silver and gold. The country’s mining industry plays a significant role in the nation’s economy and employs a large number of citizens.
As global investment and industrial demand for silver continues to rise, the New Zealand mining industry could potentially become an even larger contributor to the country’s overall GDP and economic growth.
World Silver Prices
- Arab Emirates Silver Prices
- Australia Silver Prices
- Brazil Silver Prices
- Canada Silver Prices
- Chile Silver Prices
- China Silver Prices
- Czech Republic Silver Prices
- Denmark Silver Prices
- Europe Silver Prices
- Hong Kong Silver Prices
- Hungary Silver Prices
- India Silver Prices
- Indonesia Silver Prices
- Israel Silver Prices
- Japan Silver Prices
- Malaysia Silver Prices
- Mexico Silver Prices
- New Zealand Silver Prices
- Norway Silver Prices
- Pakistan Silver Prices
- Philippines Silver Prices
- Poland Silver Prices
- Russia Silver Prices
- Singapore Silver Prices
- South Africa Silver Prices
- South Korea Silver Prices
- Sweden Silver Prices
- Switzerland Silver Prices
- Taiwan Silver Prices
- Thailand Silver Prices
- Turkey Silver Prices
- United Kingdom Silver Prices
- United States Silver Prices