


This final article concludes our 3-part mini-series on risk management. The articles are a short guide on how to look at risks in your investments and how to take proactive action to manage them and mitigate their impact on you. This is not financial advice, and we are making no specific investment recommendations. Rather, we are working through an academic exercise for the purpose of teaching how managing risk can make you a more effective investor, regardless of your style.
Please see Parts 1 and Part 2 of this series before working through this article at home. They are prerequisites for what we do next.
Risk Terms
We need to first define a few terms before we jump into our hypothetical example. Risk appetite means how much risk you are willing to take on. Risk tolerance describes how far you can stretch your risk appetite before you reach your ultimate limit. Think of it like a rubber band – you can stretch it only so far before it finally snaps and breaks. Essentially, you need to figure out your thoughts on these two concepts before you examine your portfolio or consider investment decisions. After all, we want to measure risk FIRST, and THEN manage those risks using our portfolio strategy.
Next, we describe a simple risk model anybody can use to measure the risks they want to mitigate plus the risks that each investment addresses (or doesn’t address). Once you have that risk information, you can decide what decisions to make next.
Again, this is an exercise for you to complete – we won’t be developing any specific investment recommendations that you should follow. After all, investing is a highly personal choice. Review the example below and feel completely free to make any necessary adjustments to personalize the exercise. In fact, we highly recommend it!
Risk Model
I used an Excel spreadsheet to make a risk list and assign them some values. You may choose your own risks and your own values at home – please don’t just accept mine. Spend some time developing your own view of risk in the market. Also, remember that Parts 1 and 2 (linked above in the intro) describe the process you need to do this next step. So please read them first!
Congratulations! You have advanced past 80% of other investors in your planning. Most never sit down and plan out risk and how to address it, so consider yourselves now a BIG step ahead.
An Example Risk Model
I developed the following mock risk list on an Excel spreadsheet. This list is a set of risks that I potentially see in 2023, along with a mock portfolio allocation. This is by no means a complete list. I keep it short here for brevity.
We determined the risk values, described in Step 2 Risk Measurement from Part 2 of our series, here as shown in the last column.

The graphic above is self-explanatory. I developed a set of risks, listed their consequences, and assigned risk probabilities (chance of happening, estimated) and risk levels (how much risk once the probability becomes a reality, estimated). Blending those two values together gave me a risk value, which measures both the potential of that risk to occur and how much risk is probable in the event it actually happens.
You may not only develop your own set of risks, but also your own risk values. Remember this is a highly subjective process designed to get you thinking about potential risks, and how to mitigate them. There is no right or wrong answer, nor is this supposed to be a complex math problem.
The beauty of risk management is that we do not deal in absolutes, only probabilities. This keeps the model flexible and helps us to make changes, if we need, with short notice. It is flexibility along with the risk mitigation strategy that provides value to us here.
Risk Mitigation Strategy
In the following chart, also created with Excel, I listed out the risk mitigation strategy to potentially consider, given the risk values found on the risk list above. The chart can be busy to the eye and may look confusing at first blush. Let’s talk through it quickly and it becomes much easier to understand.
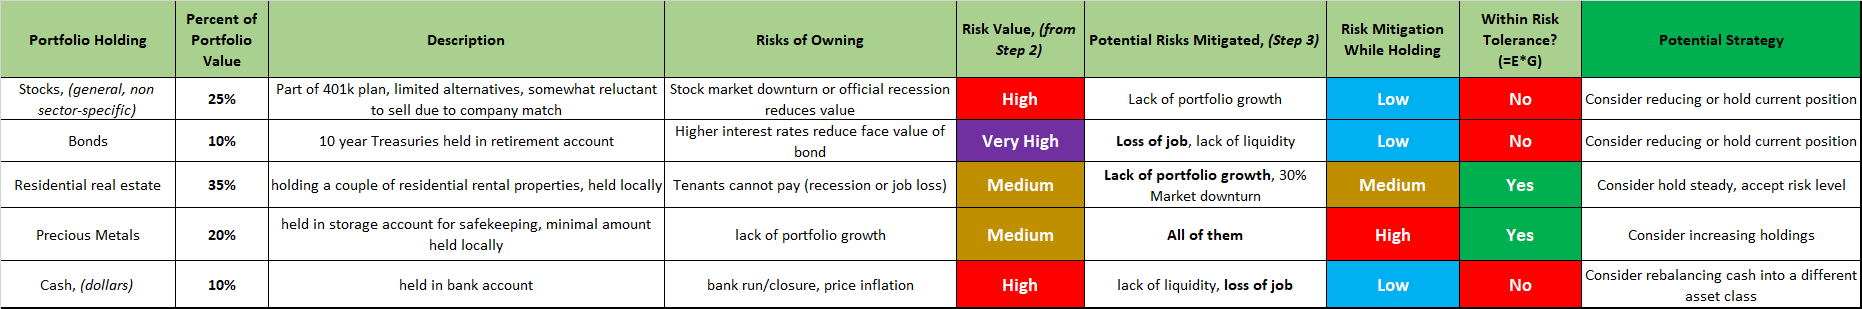
The first column lists the current portfolio holding, while the next column refers to the percentage of total value held in the example portfolio. The Description field provides a detailed description. The Risks of Owning column refers to risks that exist when we hold that particular investment.
Meaning, each investment comes with risks of its own! Not every investment has the same inherent risk value, nor do they create the same risks in owning them. That is a very important consideration – every investment choice comes with its own set of risks that we must consider before buying.
The next column, Risk Value, comes from Step 2 of the first chart we showed above. In the Potential Risks Mitigated column, we put the risks that we are reducing by holding the investment in our portfolio. The next column Risk Mitigation While Holding gives a concrete value for how well that investment reduces the risks that which we identified in Step 1.
Next to last is the Within Risk Tolerance column, which we get from adding the Risk Value and Risk Mitigation While Holding columns together. Why do this? Because it blends the value that the investment reduces, with the value that the investment also then adds to the portfolio. No investment reduces risks while bringing none. Even gold can trade sideways or down and doesn’t provide a positive return 100% of the time. So, to be fair, there is some ‘loss of portfolio value’ risk for gold in the short term.
Lastly, we have the Potential Strategy column, which is the very last step! This is where you write down any recommendations you are making for your own portfolio given the risk exercise as you complete it. These would be changes that you make to rebalance your investments, using new percentages, to address the risk levels we identified in Step 1.
Voila, you have completed your very first risk management exercise. It probably only took you a few hours from start to finish. The exercise is not a math problem; rather, it is a thought process that provides a reasonable path to understanding investment risk. Feel free to further refine this model with any level of precision you want to add. The sky is the limit. Our goal here was to provide a basic example anyone can follow, and we did just that.
Final Thoughts
I can, and have, thought many times about investment risks and how to address them. The example above may, or may not, be fit for the current risk environment. But the world always changes, and the risks of living in the world change with it. Therefore, this exercise is not one you perform once and consider it done. On the contrary, it should be an exercise revisited at least once per quarter, and/or when a big event changes the current risk landscape. Those can occur at any time.
I hope you found this short series helpful. I wanted to provide insight on how to manage risk and feel good about your investment strategy. While risks change, the common factor is that they will always be there.