


Weekly Metals Digest, Edition 1
We certainly are living in times of change, and with that we also need to change along with it. To that end, we are modifying our blog posts into a weekly digest that will encompass many of the areas of the economy and of gold and silver that we want to discuss, all in one place and at the same time.
These digests may be a bit longer than you are used to, but for which we feel will also provide a bit of extra value for you, dear reader. Do not worry about getting through all the digestion in one sitting. The beauty of the written word is that it does not disappear, and you can come back to it when you have time. Therefore, and without any further ado, I present to you the first edition of the Weekly Metals Digest.
Gold & Silver Analysis
Of course, our initial focus will be on precious metals because that is what we are all here for. In this week’s edition of the Gold and Silver Report, I want to discuss price direction. We will have a bit of technical analysis followed by some thoughts on macroeconomic factors driving the resurgence of the metals.
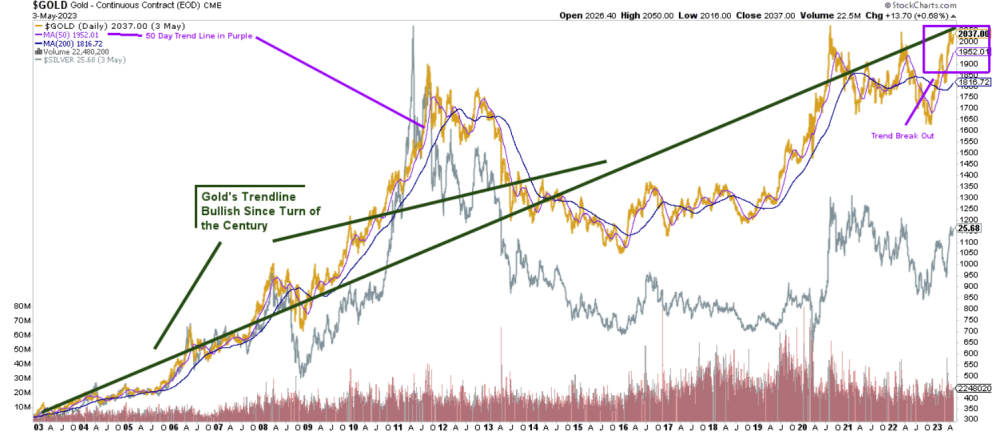
The two things I would like you to get from this gold chart are that 1) gold has been in an upward trend since the turn of the century and 2) that gold has broken out above that long term trend more recently. Both signs are bullish because they indicate not only that the world has been turning to gold for two decades, but also that the recent economic troubles are driving even more people into gold than had been moving in since 2000.
If we let that sink in, we realize that gold has been a key asset for a long time despite the view from the banks and Wall Street. In fact, the central banks have been leading the charge into adoption of gold on their balance sheets. But perhaps MORE importantly is the fact that despite gold being on this massive multi-decade run, it is now breaking out FROM that bullish trend line and into new territory. In plain English, gold adoption is accelerating around the world as more currency and banking problems arise.
Getting a bit more granular for a moment, we see that gold has broken out not only past its 200-day moving average, but also the 50-day. The moving averages tell us the trend of the price over a specific period. The 200-day is a common measure of medium-term direction, while the 50-day is a shorter-term confirmation of both the current direction and strength of the 200-day trend. Both have broken out, meaning buyers are so into gold that they are buying it up even faster than they have been for two decades. This is certainly bullish for prices.
Silver’s price action is a bit of a different animal at this point, but no less bullish. We will explain what we mean by that as we go.
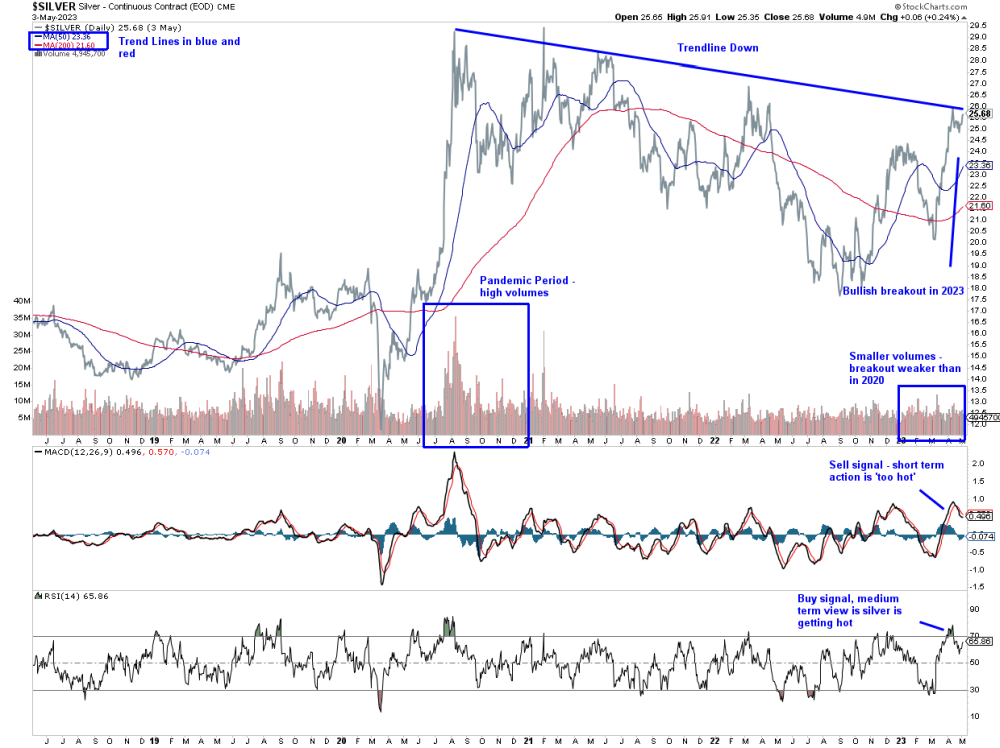
What you see in silver’s price chart is the yappy dog that cannot decide which way it wants to go. While gold has been in a decided uptrend since 2000 and the Tech Crisis, silver has been bouncing all over the place. In our short-term chart over the last few years, silver has been trending downward. That does not seem terribly bullish, but remember silver is an industrial commodity first. This fact changes the discussion on how we view the metal.
Even though silver has been money over civilizations dating back 6 millennia, the world now squarely sees it for its industrial uses. You can find those in our article on the uses of silver. The commodities markets around the world price silver according to short term supply and demand terms, and not as long-term money or liquid banking asset. Therefore, the price action in silver is just going to be different than in gold, whose primary use is still as the safety asset of last resort, as well as the ultimate store of value in the banking system.
When reading a silver chart, one must take those factors into the equation. Silver will run after its big brother gold does because gold breaking out tells silver to start acting like money again. Therefore, I expect positive signs in silver when gold is busy reaching new all-time highs and has grabbed the attention of the financial markets. We are starting to see this happening already.
Short term, silver appears to be in an oversold condition as we see on the MACD indicator on the silver chart above. This is just an industrial market signal, and indicates the market wants silver price to move down. However, we also see stronger medium-term bullishness on the RSI indicator on the chart that gives silver quite a bit more room to run before it needs to cool off.
I will interpret that last paragraph for you in plain English, for those that are not technical chartists. Silver is giving the signal that it is in supply deficit because the mines have not produced enough for the last 4 years, and people expect the price to rise over time because of this. However, the market NEEDS lower silver prices in the short term to satisfy industrial demand so we can make iPhones, computers, lasers, and other technology.
Even more simply – manufacturers are begging for cheap silver while the miners are telling the market a sharp rise in price is coming because of the current supply deficits. Expect silver to rise with gold, though it may take a much rockier path to get there as industry needs to battle it out with investors who cannot afford to buy gold that want silver for asset safety.
This means we should expect more violent price swings in silver as the market participants play musical chairs waiting for the last bit of silver to run out after the music shuts off in this market and some buyers are left without any silver to show for it. My recommendation is not to be one of those buyers at the end with no silver. If you are interested in buying silver, then get yours now before you cannot find it.
The Macro View
In this week’s economic analysis, we look at corporate failures to see how well the economy is really doing this year when compared with the recent past. The following chart shows how quickly we are racking up corporate bankruptcies in 2023, led by former stalwart Bed Bath and Beyond.
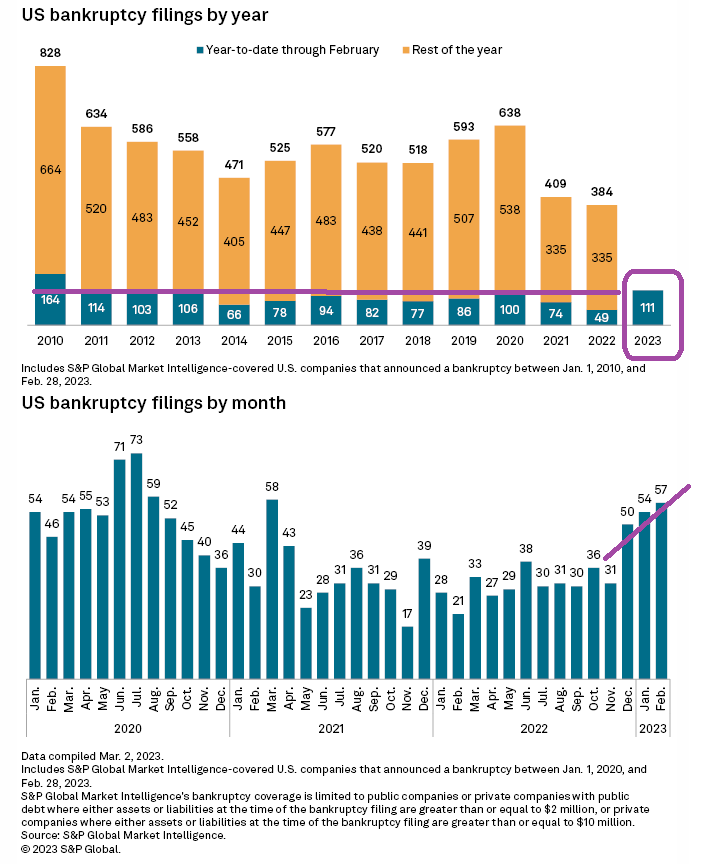
The chart above shows that US bankruptcy filings are the highest in the first quarter than they have been since 2010-2011, during the aftermath of the Great Recession. And folks, we are not even in a recession yet in official terms, with a positive GDP print during the first quarter. But obviously, the problems in the banking sector are not waiting around for the government to make the recession call official.
And that means we need to pay attention to what is going on now, and not wait for the government to provide official guidance. At this point in the economic cycle, it is really every man and women for themselves.
The following chart shows the first downturn in US cash deposits into domestic-chartered banks since the 1970s when the dollar left the gold standard and became a free-floating currency. Part of the obvious reason for this is that the government printed so much more money when the anchor to gold was lifted in 1971 by then President Nixon. The chart also reflects the massive injections of fresh capital, through the QE program by our central bank, manifesting in higher and higher deposit levels into the banking system.
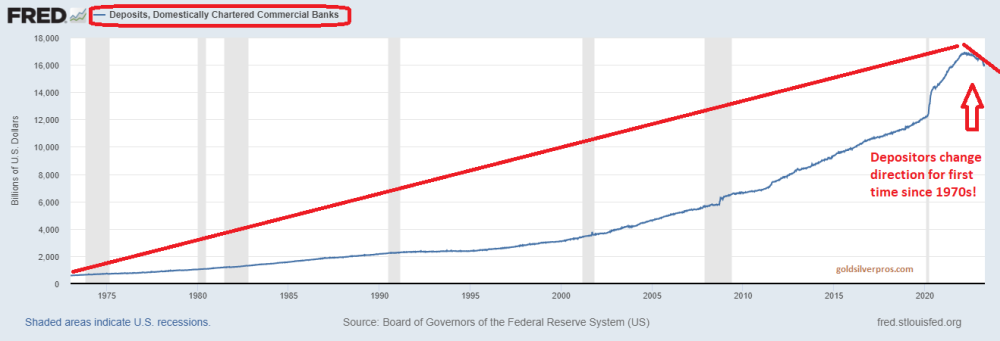
Deposits have slowed partially because the Federal Reserve (Fed) began reducing cash in the system through their quantitative tightening program dating back to 2022. In addition, depositors are willingly withdrawing cash from the banking system after the recent bank failures of First Republic, Silvergate, Signature and SVB, effectively compounding the liquidity problem started by the Fed. I believe this liquidity problem will be at the heart of any continued banking and corporate bankruptcies.
The economy itself is mixed right now, with residential real estate continuing to flounder even as mortgage rates have stabilized around 5% for a 30-year conventional. Pending home sales have fallen by 5.2% over the last month, while new home sales saw an unexpected surge in March, up over 60,000 from last month. The Case-Schiller home price index also rose a bit at 0.4%. The data tells me that while the housing market is holding serve, higher rates have affected current deals in place for existing homes. People are opting to buy new ones where they are purchased, which is a smaller portion of the market overall.
Anecdotally, I also believe that people are choosing to renovate instead of buying a new home as well. I was a real estate investor from 2000-2018 in North Texas, and recently engaged one of my contractors for a bid on a remodel. My contractors are all so busy I have a hard time getting them on the schedule to do jobs. This is in stark contrast to a few years ago when I could not keep them busy enough.
This week manufacturing indexes fell into negative growth while the service economy continued to expand. Labor costs rose 4.5% adding burdens to businesses dealing with inflationary prices and consumers who cannot spend any more on goods. US productivity fell by 2.7% as companies struggled to keep their doors open in this stagflationary environment.
Next week we get some CPI (consumer) and PPI (producer) inflation data. I expect to see a bit of a break in price inflation as the economic output of the nation continues to stall, leaving warehouses stuffed with unused inventories. I feel as though we are going into a mini-deflationary cycle which will ease prices on some goods and raise them on others in shortage.
Expect higher energy and food costs, while rents come off a bit from their highs and non-staple type goods see more stabilization in prices. For more on the economic situation, please join the JM Bullion YouTube channel where we post a weekly market wrap-up video every Friday.
Note of the Week
We will pick a topic of the week that we feel exemplifies the most important economic trends. This week’s topic, of course, covers the banking sector. This chart shows the SPDR regional banking index which includes those regional banks that have been most affected in 2023.
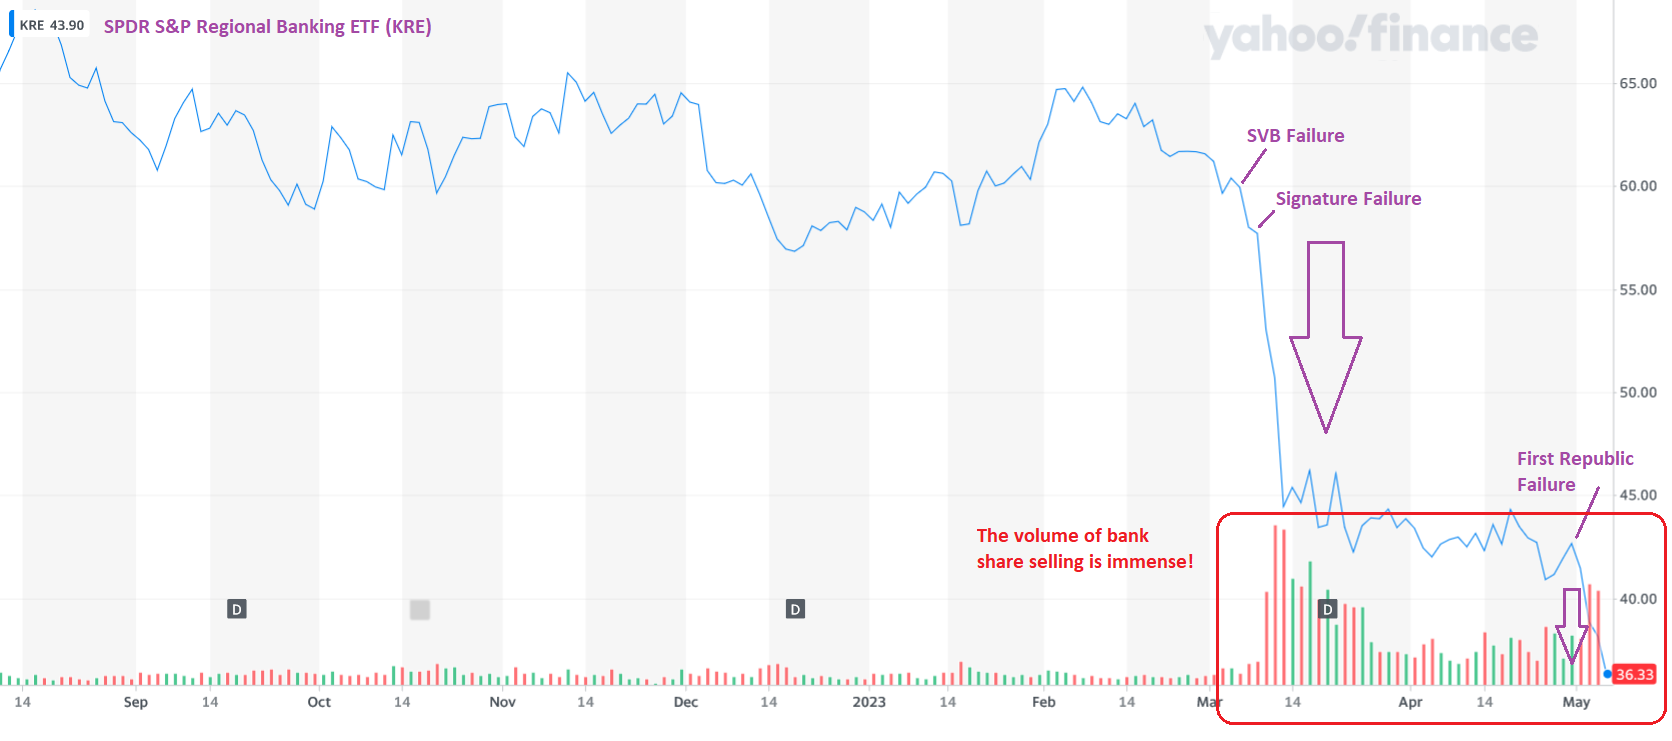
A few important bank failures are affecting the entire complex of US regional banks, which is NOT good for their long-term solvency. Businesses have two main avenues of financing themselves which include debt (bonds) and equity (stocks). The failure of the three large regional banks in the US have caused the entire regional banking sector in the US to lose a critical financing and liquidity source in their stocks.
With US treasury rates rising, causing bond prices to fall in response, both sources of financing for banks are taking a major hit at the same time. What happens next? Dear reader, we are in a bit of a maelstrom now and only time will tell how deep the problems really go.
Executive Summary
The precious metals are in a new leg of the 20+ year bull market dating back to the Tech Crisis in 2000. Recent issues in inflation, supply chain, and now the bond markets are negatively affecting liquidity in the marketplace. The net result is suffering banks and businesses that are likely to compound until the contagion of bad debt and the falling dollar are arrested. Whether or not the Fed, our central bank, can fix these problems is the subject of much current debate in mainstream financial media.
However, instead of waiting for the authorities to fix things, history shows there will likely be more pain before official policies are effective enough to arrest the freefall and shore up our financial system. In the meantime, gold and silver are showing their true worth.
The big dog, gold, is awake and barking, but has not gotten up to chase the mailman just yet. When gold is ready, little brother silver will follow. And that will be a ride to see as industry and investors battle it out for a severely depleted inventory of silver across world depositories. I expect silver’s rise to be much more aggressive than gold’s when the dust finally settles.
Coin of the Week
I am going to keep it simple this week and highlight the pride of the American mint, the American Gold Eagle coin. A staple in every coin collector’s stable, the gold eagle is a world-recognized gold coin that is highly liquid and holds its value well. You could call it the “Toyota” of the precious metal sovereign coins for its tendency to retain the most resale value of the bunch. It is hard to go wrong with one of these in your portfolio of precious metals.