


Pullbacks are healthy in all markets, as most operate somewhere around ½ market data and ½ emotions and everything else. We are all human, and our ability to process information and place that information into a trading strategy takes time. We will ask our friends, read financial blogs, study the data, and do whatever else we do to determine how to play the markets. And sometimes markets just need to cool off after a big run, especially when we are in times of higher uncertainty as to what is happening next.
Gold Still Bullish
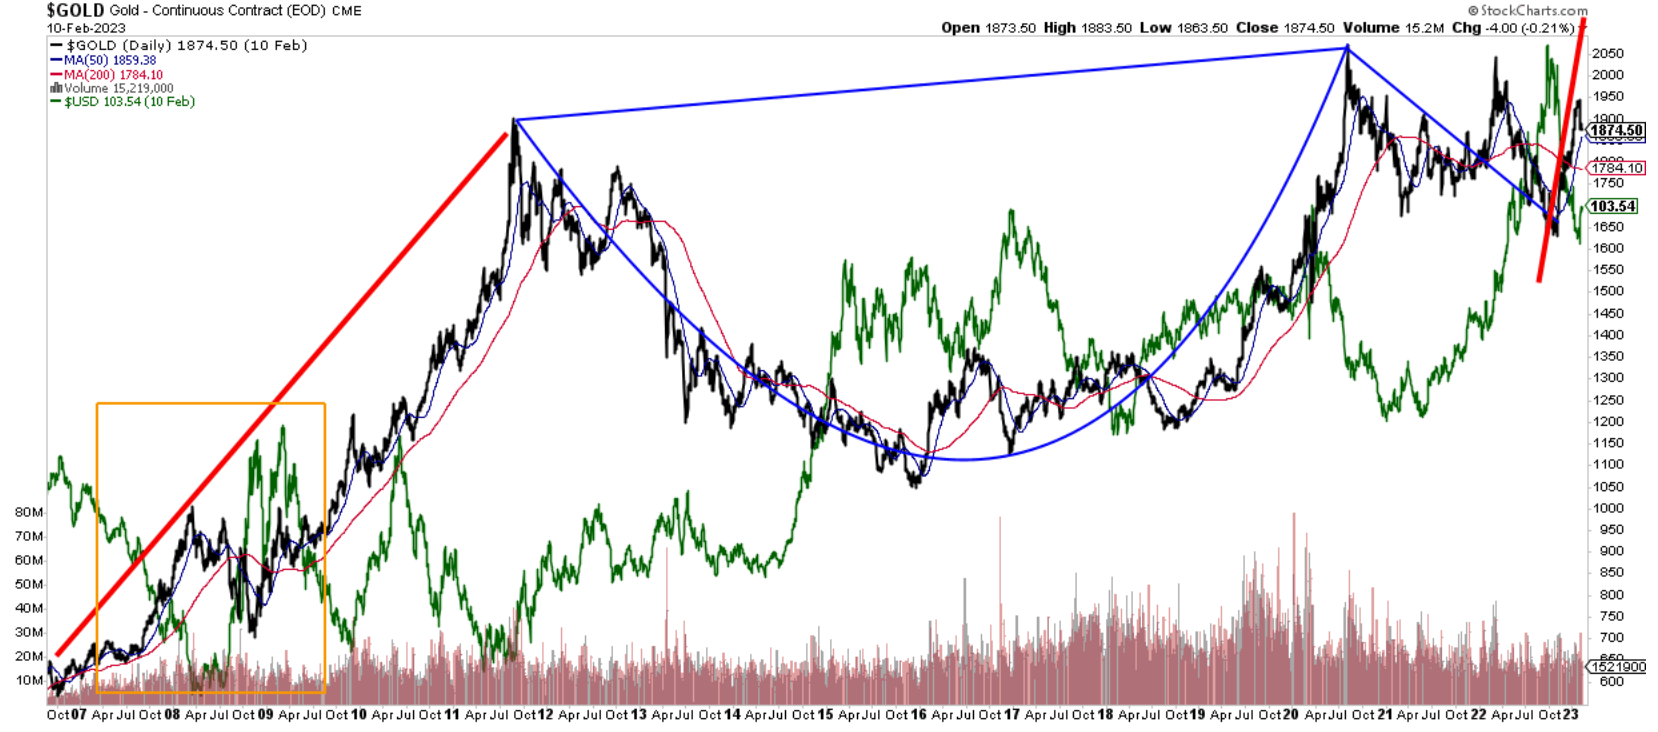
I marked the chart above with the classic “cup and handle” pattern that is typically seen as bullish in just about any market. Investopedia explains the origin of the cup and handles thusly.
“American technician William J. O’Neil defined the cup and handle (C&H) pattern in his 1988 classic, How to Make Money in Stocks, adding technical requirements through a series of articles published in Investor’s Business Daily, which he founded in 1984.1 O’Neil included time frame measurements for each component, as well as a detailed description of the rounded lows that give the pattern its unique teacup appearance.
As a stock forming this pattern tests old highs, it is likely to incur selling pressure from investors who previously bought at those levels; selling pressure is likely to make price consolidate with a tendency toward a downtrend trend for a period of four days to four weeks, before advancing higher. A cup and handle is considered a bullish continuation pattern and is used to identify buying opportunities.”
While cup and handle patterns can occur on weekly basis, they can also occur over time. To wit, analysts at Investopedia note:
“Like all technical indicators, the cup and handle should be used in concert with other signals and indicators before making a trading decision. Specifically, with the cup and handle, certain limitations have been identified by practitioners. The first is that it can take some time for the pattern to fully form, which can lead to late decisions. While one month to one year is the typical timeframe for a cup and handle to form, it can also happen quite quickly or take several years to establish itself, making it ambiguous in some cases.”
Pullbacks Can Be Normal
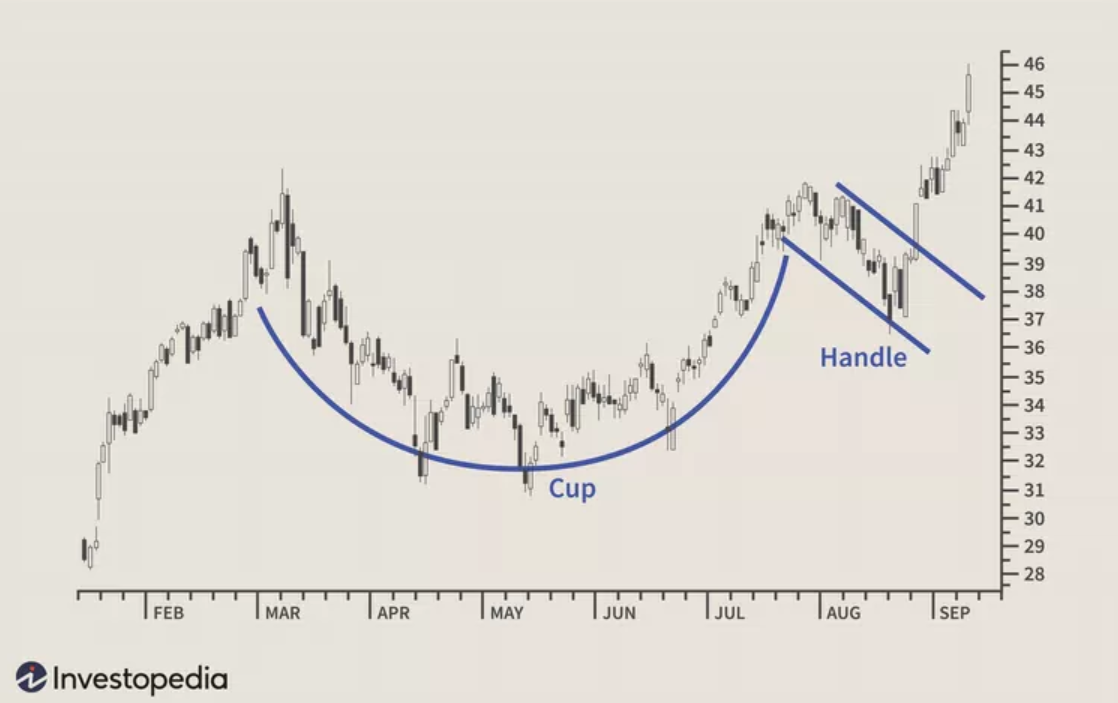
In the case of the aforementioned trading pattern, the handle on the chart refers to the consolidation phase where price will pull back, often to 50% of the previous high as seen in the following example.
What’s further, the resuming leg of the bull market tends to be quite exceptional in many cases. Case studies have shown 4-5x moves in some assets following the completion of a cup and handle pattern. However, no technical pattern holds true in every instance. Just because we have a confirmed cup and handle pattern in gold doesn’t guarantee we will have a large move upward. But, the recovery in gold and the completion of the pattern indicate much stronger buying demand at a time when risk in the markets is significantly rising.
Generalist Demand Returns
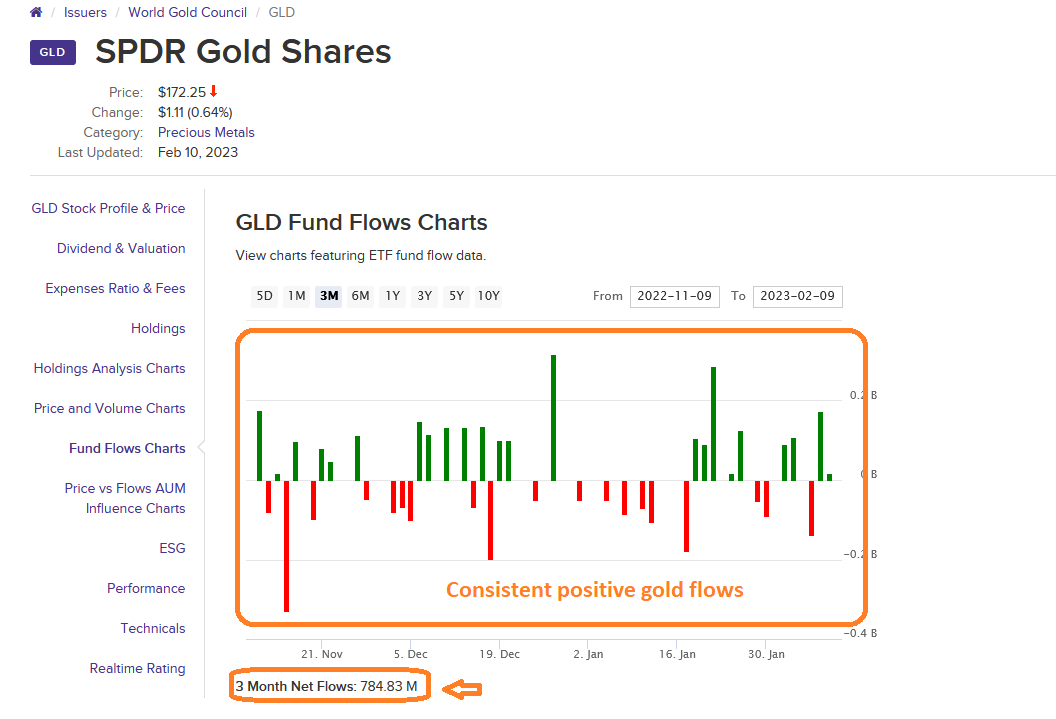
One indicator of increased demand for precious metals flows into passive vehicles GLD and SLV, which represent generalist investor demand for gold and silver, respectively.
In the following picture, we can see that over the last three months, almost $800 million has flowed into the GLD fund set up for passive investors. Investors in GLD do not see actual physical metal or have redeemability rights unless they are Authorized Participants (AP). AP’s are large trading institutions that provide and take out gold from the funds needed to meet the demand for the shares.
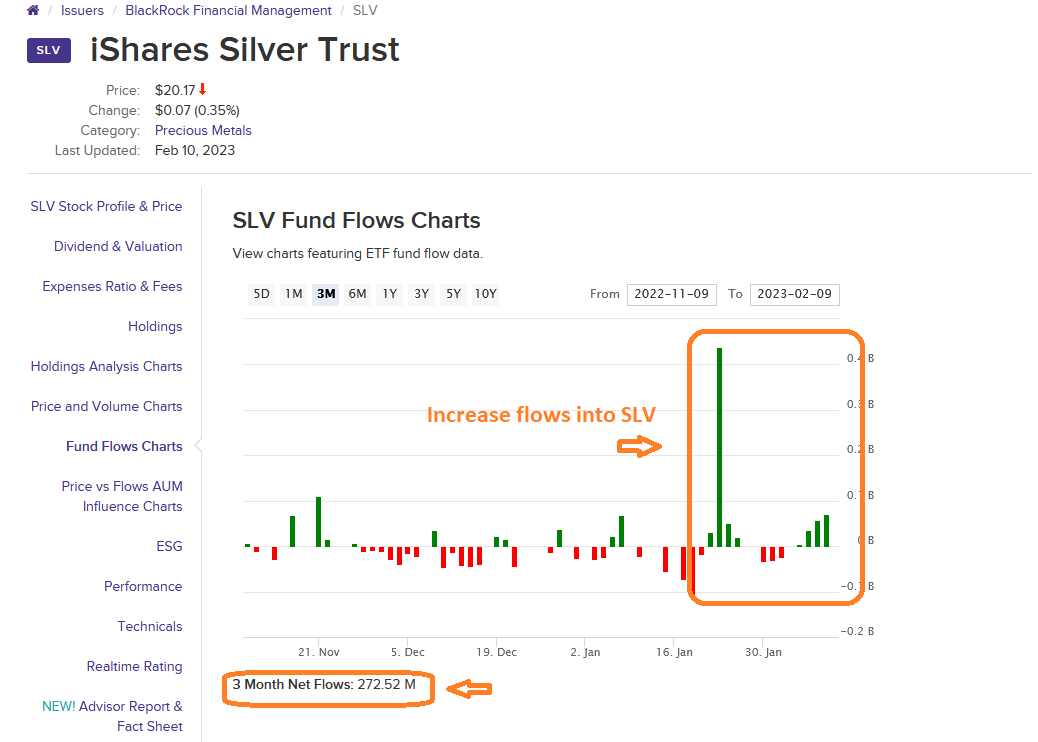
The following chart highlights the money flowing into SLV over the last three months to the tune of $272.5 million. SLV is also a passive fund, run much like GLD, in which share owners do not ever own or touch the physical metal. However, the fund tries to closely track the price of silver and give investors exposure to price movements if nothing else.
So it appears as though generalist investors are starting to wet their whistle on precious metals. We have not seen the type of inflows that we have seen before during previous bull runs just yet. My suspicion is we are just getting started on the next leg up in both gold and silver. Let’s summarize why in the last section of the article.
Final Thoughts
Our weekly market wrap-up videos on the YouTube channel are a great way to keep up with key economic indicators. Summarized, I am seeing weaknesses in the following areas:
- Jobless claims
- Headline employment (minus ‘adjustments’)
- Real estate prices and home starts
- Bond rates flashing recession
- Consumer debt levels excessive
- Sovereign debt levels excessive
- Rolling inflation/deflation cycles
- Shipping and warehouse data show we are headed for economic deflation
- Rising interest rates
- S&P 500 stock earnings negative so far for 4th quarter
There are more data points to consider, but those are quite a few of the ones that are on the downtrend. We will continue to follow those and do our best to analyze what could be happening next in the economy.
Rob Kientz is a precious metals industry expert with over twenty years of investment experience in bond, stock, real estate, commodities, Forex, and precious metals markets.